

In my last post I had a look at the basic P/E ratio, but there are a couple of variations and an anomaly that are also worth being aware of.
Forward price/earnings ratio
It is not unusual to hear market experts talking loosely about forward price/earnings ratios. I think that these should come with a handful of salt. What is meant here is the ratio of the share price to future earnings, i.e. earnings that have not actually been earned yet; in reality just analysts’ best guesses. To be sure, these future earnings estimates are often better than nothing (they certainly make for something to talk about), but often not by much. Future earnings should not be confused with real earnings sitting in the bank (whether on-shore or off-shore).
While I admit that I do use Morningstar to obtain analysts’ predictions for future earnings, I do make sure to apply a chunky discount (at least 15%) to these ever-optimistic guesses. I think that this discount should also be applied when calculating forward P/E ratios. But most of the time, of course, it isn’t.
CAPE ratio
The Cyclically Adjusted Price/Earnings (CAPE) ratio, also known as the Shiller ratio, was advanced by Robert Shiller as a valuation measure that can be applied to equity indexes. Shiller divides the average of ten years of real (adjusted for inflation) earnings into a broad index of market prices. His intention was to smooth out the spikes caused by the natural volatility in earnings over a business cycle.
Ben Graham, in the Intelligent Investor, seems to have been thinking along similar lines (about fifty years earlier) when he advocated, as part of his defensive stock selection technique, looking for a price to be “not more than 15 times average earnings of the past three years” (chapter 14).
Regardless of where the idea originated, I think that the important point is to bear in mind, when musing on an intriguing multiple, that earnings tend to be volatile and that, by smoothing the numbers over a number of years, or better still the business cycle, you will get a truer picture of a company’s earnings.
Negative earnings
Speaking of volatility, this can lead to the unpalatable business of losses: airlines, banks, and property developers amongst others are certainly no strangers to the occasional year of negative earnings. These negative per-share earnings of money-losing enterprises can result in equivalently negative P/E ratios. Happily, these unsightly negatives are usually obscured from the unwary potential investor by means of a diplomatically placed “-” or the trusty “n/a”. Can you guess the bank lurking behind these woeful figures?
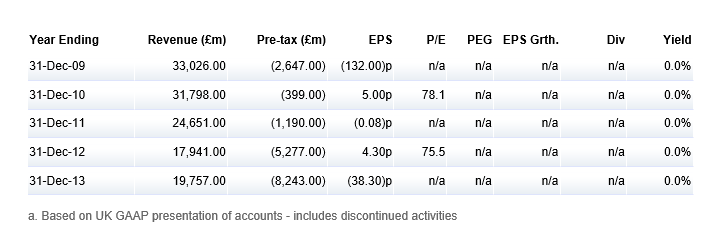
Yup, RBS.